Book Recommendation System
Book Recommendation System
Recommendation Types:
-
Content base Filters : Based on properties of content that user select ( bases on same user only)
-
Collaborative Filters :
-
There are two classes of Collaborative Filtering:
-
User-based, which measures the similarity between target users and other users,if number of user is limited (like message you see ‘user who select this item is also select the-following items’).
-
Item-based, which measures the similarity between the items that target users rate or interact with and other items, if number of items is limited.
-
-
In this work we perform a data analysis to build a book functional recommendation engine, we don’t use here any advanced techneque to build the model or any deep learning model. We just use the data analysis techniques and feature engineering to build the recommendation engine. so it’s mainly based on data analysis tasks not a deep learning one.
Technical Analysis
The data book we have contians 12 feature to work with, we mainly want to know what is the most book have been rated by the user and what is the best books there, we want to know also who is the best author there. so we will use some data analysis techniques to answer these questions.
Data Exploration
We have 12 features to work with, not all are useful so we will use some of them to help us in our work
here is the data we have:
let’s see what is the shape of the data and the attributes informations
df.shape
(11123, 12)

df.info()
RangeIndex: 11123 entries, 0 to 11122
Data columns (total 12 columns):
 #   Column              Non-Null Count  Dtype
---  ------              --------------  -----
 0   bookID              11123 non-null  int64
 1   title               11123 non-null  object
 2   authors             11123 non-null  object
 3   average_rating      11123 non-null  float64
 4   isbn                11123 non-null  object
 5   isbn13              11123 non-null  int64
 6   language_code       11123 non-null  object
 7     num_pages         11123 non-null  int64
 8   ratings_count       11123 non-null  int64
 9   text_reviews_count  11123 non-null  int64
 10  publication_date    11123 non-null  object
 11  publisher           11123 non-null  object
dtypes: float64(1), int64(5), object(6)
# let's also check for the categorical columns
df.describe(include='object')
as we see that isbn is a unique column, so we will drop it as it not help us as much for recommendation. we see that there is a 2290 publisher and 6639 authors with 27 language.
- there is no nulls or dublicates in the data which is good.
Feature Engineering
we will use some feature engineering to help us in our work, so we will create some new features to help us in our work. also we will drop the columns that we don’t need.
As the bookID, isbn and isbn13 columns are unique for each row in the data. Therfore, they cannot help us in recommending books. So we will drop them.
df.drop(['bookID','isbn','isbn13'], axis=1, inplace = True)
let’s create a year feature from date column to help us in the analysis, it will be more helpful than the data column.
df['year'] = df['publication_date'].str.split('/').apply(lambda x: x[2])
# Let's check the minimum and maximum year
print("First year any book released ",df['year'].min())
print("Last year any book released ",df['year'].max())

First year any book released  1900
Last year any book released  2020
so the minimum year is 1900 and the maximum year is 2020.
Data Analysis and Visualisation
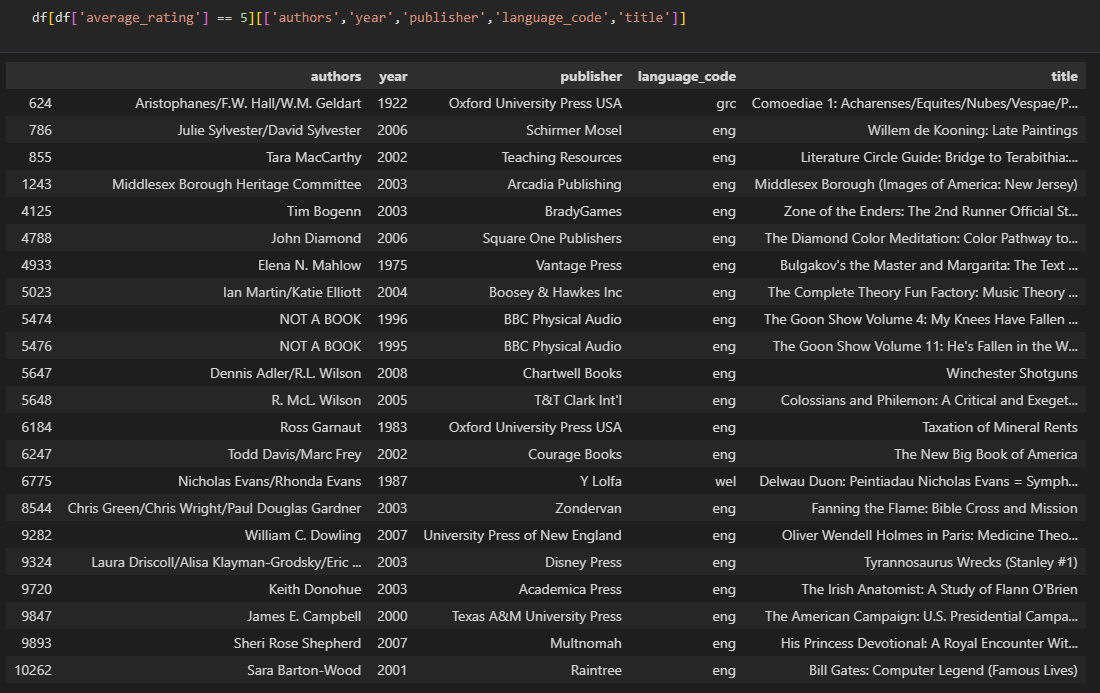
let’s see the book with it’s publisher and authors with average rate of 5 which is the highest rate we have in our dataset.
df[df['average_rating'] == 5][['authors','year','publisher','language_code','title']]
let’s to have a better look from the describtion
df[df['average_rating'] == 5][['authors','year','publisher','language_code','title']].describe(include='object')
As we see that there is only 1 author who have the highest rate two times. there is only 3 language code that have the highest rate
let’s have a look of the ratings:
df.groupby(['average_rating'])['title'].agg('count').sort_values(ascending=False).head(15)

average_rating
4.00    219
3.96    195
4.02    178
3.94    176
4.07    172
3.93    168
4.05    168
3.92    168
3.89    166
3.83    166
3.98    164
3.82    163
3.97    163
3.99    162
4.04    158
Name: title, dtype: int64
- We can see that most of the rates are between 3.80 and 4.07.
let’s have alook of the most authors:
df.groupby(['authors'])['title'].agg('count').sort_values(ascending=False).head(10)

authors
Stephen King           40

P.G. Wodehouse         40
Rumiko Takahashi       39
Orson Scott Card       35
Agatha Christie        33
Piers Anthony          30
Mercedes Lackey        29
Sandra Brown           29
Dick Francis           28
Laurell K. Hamilton    23
Name: title, dtype: int64
As we see that the most authors are Stephen King, P.G. Wodehouse, Rumiko Takahashi, Orson Scott Card, Agatha Christie, Piers Anthony, Mercedes Lackey, Sandra Brown, Dick Francis and Laurell K. Hamilton.
let’s have a look of the most language code:
df.groupby(['language_code'])['title'].agg('count').sort_values(ascending=False).head(10)

language_code
eng      8908
en-US    1408
spa       218
en-GB     214
fre       144
ger        99
jpn        46
mul        19
zho        14
grc        11
Name: title, dtype: int64
Of course the english is the most popular language here.
# Now, let's check the top 15 years in which maximum books were published
df.groupby(['year'])['title'].agg('count').sort_values(ascending= False).head(15)

        title	                         authors	      average_rating	 language_code	 publisher
9664	A Quick Bite (Argeneau 1)	  Lynsay Sands	        3.91	          eng	          Avon
We can see that there is only one book A Quick Bite was released in the year 2020 written by Lynsay Sands and published by Avon.
Now, let’s check the top 15 years in which maximum books were published
df.groupby(['year'])['title'].agg('count').sort_values(ascending= False).head(15)

year
2006    1700
2005    1260
2004    1069
2003     931
2002     798
2001     656
2000     534
2007     518
1999     450
1998     396
1997     290
1996     250
1995     249
1994     220
1992     183
Name: title, dtype: int64
What is the TOP Author who published the most books?
# Visualise the top 10 authors with maximum number of books
plt.style.use('fivethirtyeight')

plt.figure(figsize=(30,5))

sns.countplot(x = "authors", data = df,
              order = df['authors'].value_counts().iloc[:10].index, palette = "coolwarm")
plt.title("Top 10 Authors with Maximum Books",fontdict={'size':25})
plt.xticks(fontsize = 15)
plt.show()
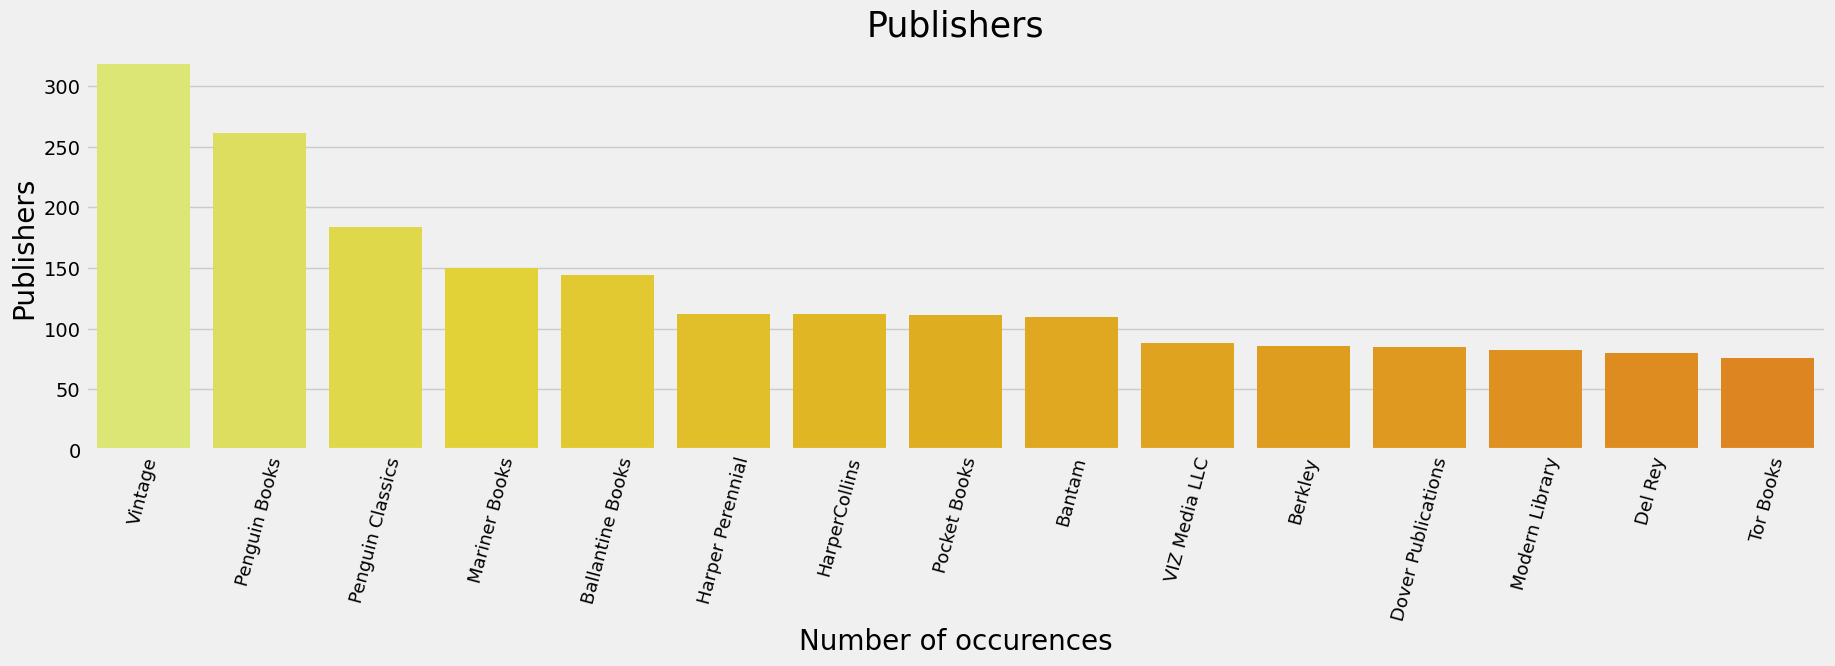
What is the TOP Publisher who published the books?
plt.style.use('fivethirtyeight')

plt.figure(figsize=(30,5))

sns.countplot(x='publisher', data=df,
              order=df['publisher'].value_counts().iloc[:10].index,
              palette = palette_4)
plt.title("Top 10 Publisher with Maximum Books",fontdict={'size':25})
plt.xticks(fontsize = 15)
plt.show()
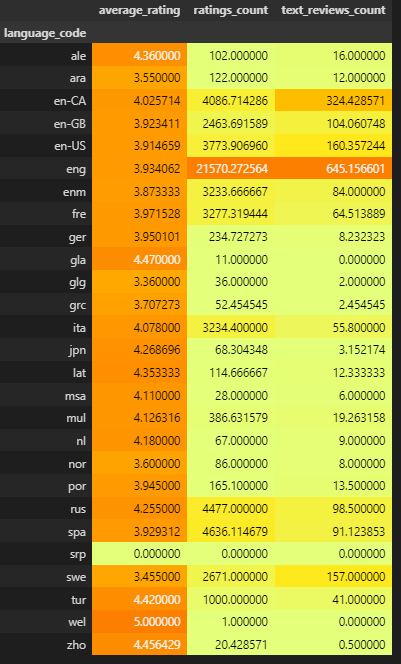
Checking the means ratings_count, text_reviews_count and average_rating for each language code
we do that for the language as it only has 27 unique attribute.
df.groupby(['language_code'])[['average_rating','ratings_count','text_reviews_count']].agg('mean').style.background_gradient(cmap='Wistia')
We can see that the average_rating for eng and en-CA is the highest corrosponding to the ratings_count and text_reviews_count. which we see that eng has average_rating of 3.93 with ratings_count of 21570 and text_reviews_count of 645. Moreover en-CA has average_rating of 4.02 with ratings_count of 4086 and text_reviews_count of 324.
What is the most Most occuring books?
# Most occuring books in the data
plt.figure(figsize = (30,5))

book = df['title'].value_counts()[:15]
sns.barplot(y=book, x = book.index, palette = 'winter_r')

plt.title("Most occuring books",fontsize = 25)
plt.xlabel("Number of occurences", fontsize = 15)
plt.ylabel("Books", fontsize = 20)
plt.xticks(rotation = 75,fontsize = 17)
plt.show()
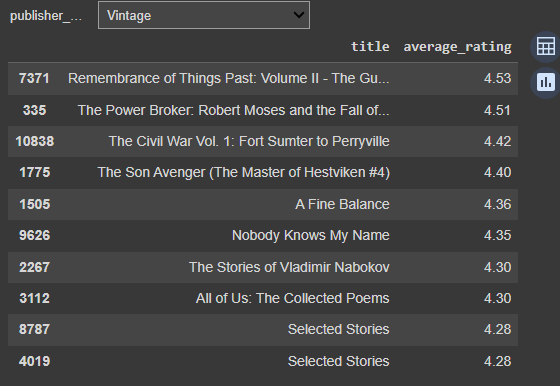
Recommending Books based on Publishers
# interactive function for recommending books based on publishers
@interact
def recommend_books_on_publishers(publisher_name = list(df['publisher'].value_counts().index)):
    a = df[df['publisher']==publisher_name][['title','average_rating']]
    a = a.sort_values(by = 'average_rating', ascending=False)
    return a.head(10)
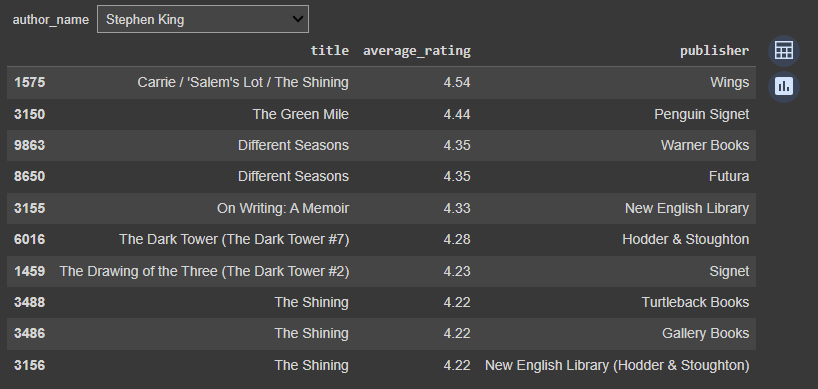
Recommending Books based on Authors
# recommending books based on authors
@interact
def recommend_books_on_authors(author_name = list(df['authors'].value_counts().index)):
    a = df[df['authors']==author_name][['title','average_rating','publisher']]
    a = a.sort_values(by = 'average_rating', ascending=False)
    return a.head(10)
Books based On Title
@interact
def books(x = list(df['title'].value_counts().index)):
    a = df[df['title']==x][['title','publisher','ratings_count']]
    a = a.sort_values(by = 'ratings_count', ascending = False)
    a = a.style.background_gradient(cmap = 'coolwarm')
    return a
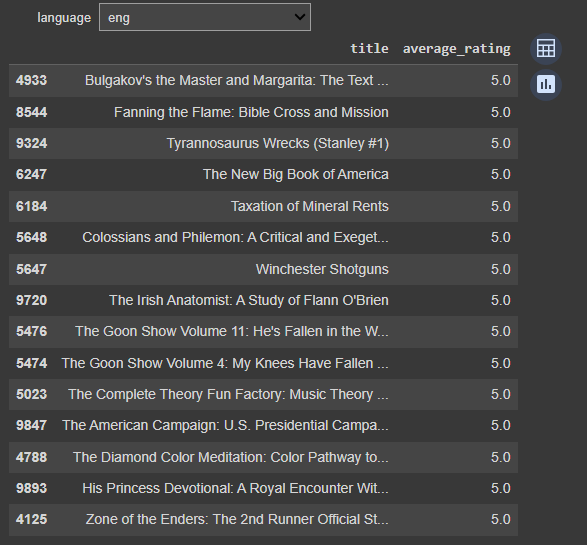
Recommend books based on languages
@interact
def recommend_books_on_languages(language = list(df['language_code'].value_counts().index)):
    a = df[df['language_code']==language][['title','average_rating']]
    a = a.sort_values(by = 'average_rating', ascending=False)
    return a.head(15)
Book Recommender Using Neighbour Algorithm
# converting average rating column into categorical column
def num_into_obj(x):
    if x>=0 and x<=1:
        return 'between 0 and 1'
    elif x>1 and x<=2:
        return 'between 1 and 2'
    elif x>2 and x<=3:
        return 'between 2 and 3'
    elif x>3 and x<=4:
        return 'between 3 and 4'
    else:
        return 'between 4 and 5'

df['rating_obj'] = df['average_rating'].apply(num_into_obj)

# Let's encode the categorical column
rating_df = pd.get_dummies(df['rating_obj'])
rating_df.head()

# Let's encode the language code column as well
language_df = pd.get_dummies(df['language_code'])
language_df.head()

# Let's concat both the data frames and set the title column as the index
features = pd.concat([rating_df, language_df, df['average_rating'], df['ratings_count'],df['title']], axis=1)
features.set_index('title', inplace=True)
features.head()

# for scaling the values of the data frame
from sklearn.preprocessing import MinMaxScaler
# scaling down the values of the data frame
min_max_scaler = MinMaxScaler()
features_scaled = min_max_scaler.fit_transform(features)

# importing neighbours
from sklearn import neighbors

# training the model
model = neighbors.NearestNeighbors(n_neighbors=6, algorithm='ball_tree', metric='euclidean')
model.fit(features_scaled)
dist, idlist = model.kneighbors(features_scaled)
@interact
def BookRecommender(book_name = list(df['title'].value_counts().index)):
    book_list_name = []
    book_id = df[df['title'] == book_name].index
    book_id = book_id[0]
    for newid in idlist[book_id]:
        book_list_name.append(df.loc[newid].title)
    return book_list_name


